Thursday, 12th July 2012. The FBM KLCI keep on recording new high with steady climb after the May manufacturing data was reported better than expected. Other news to follow.
"- U.S. stocks fell Wednesday, with the S&P 500 extending its longest losing streak in more than six weeks, after the Federal Reserve failed to deliver a firmer read on additional stimulus. After dropping 118 points, the Dow Jones Industrial Average DJIA -0.38% ended at 12,604.53, down 48.59 points, or 0.4%. The S&P 500 SPX -0.0015% shed a slight fraction to close at 1,341.45, with industrials hardest hit and energy the best performer among the index’s 10 sectors. The Nasdaq Composite COMP -0.49% , down for a fourth session, shed 14.35 points, or 0.5%, to 2,887.98."
"-Japanese and Australian shares on Wednesday ended modestly lower for a fifth straight day of losses, amid fears about Chinese growth and deepening European debt troubles.
"-August Soybeans finished down 16 at 1574 1/2, 50 1/2 off the high and 21 1/2 up from the low. November Soybeans closed down 15 at 1523 1/2. This was 18 1/4 up from the low and 51 1/2 off the high. August Soymeal closed down 5 at 463.3. This was 8.3 up from the low and 17.5 off the high. August Soybean Oil finished down 0.47 at 53.82, 1 off the high and 0.36 up from the low. November soybeans traded sharply higher following the release of the USDA report but slowly lost ground to trade lower into the close. Technical traders see the sweeping key reversal from a contract high as a negative technical development. Soybean meal and oil also traded sharply lower on the day. Soybeans saw spillover pressure from a sharply lower corn market after the report was considered supportive for soybeans. The USDA pegged US soybean ending stocks for the 2012/13 season at 130 million bushels as compared with 140 million last month. Yield was adjusted lower to 40.5 bushels/acre from 43.9 posted last month. This is a 4.18% stocks to usage ratio and the USDA had to cut demand by 150 million bushels (crush and export) from last month's estimates to make the numbers fit. This would be the lowest stocks/usage number since the 1964/65 season. World ending stocks for the 2012/13 season came in at 55.66 million tonnes compared with 58.5 million tonnes last month and 52.51 million this year. The longer term outlook for soybeans remains positive as traders are anticipating an increase in U.S. soybean demand in the coming year due to the lower crop production out of South America. The weather forecast is still questionable for the central Midwest with rain in the forecast for the southeast and drier conditions in the west. Temperatures in the west could reach 90 to 100 degrees adding further stress to soybeans."
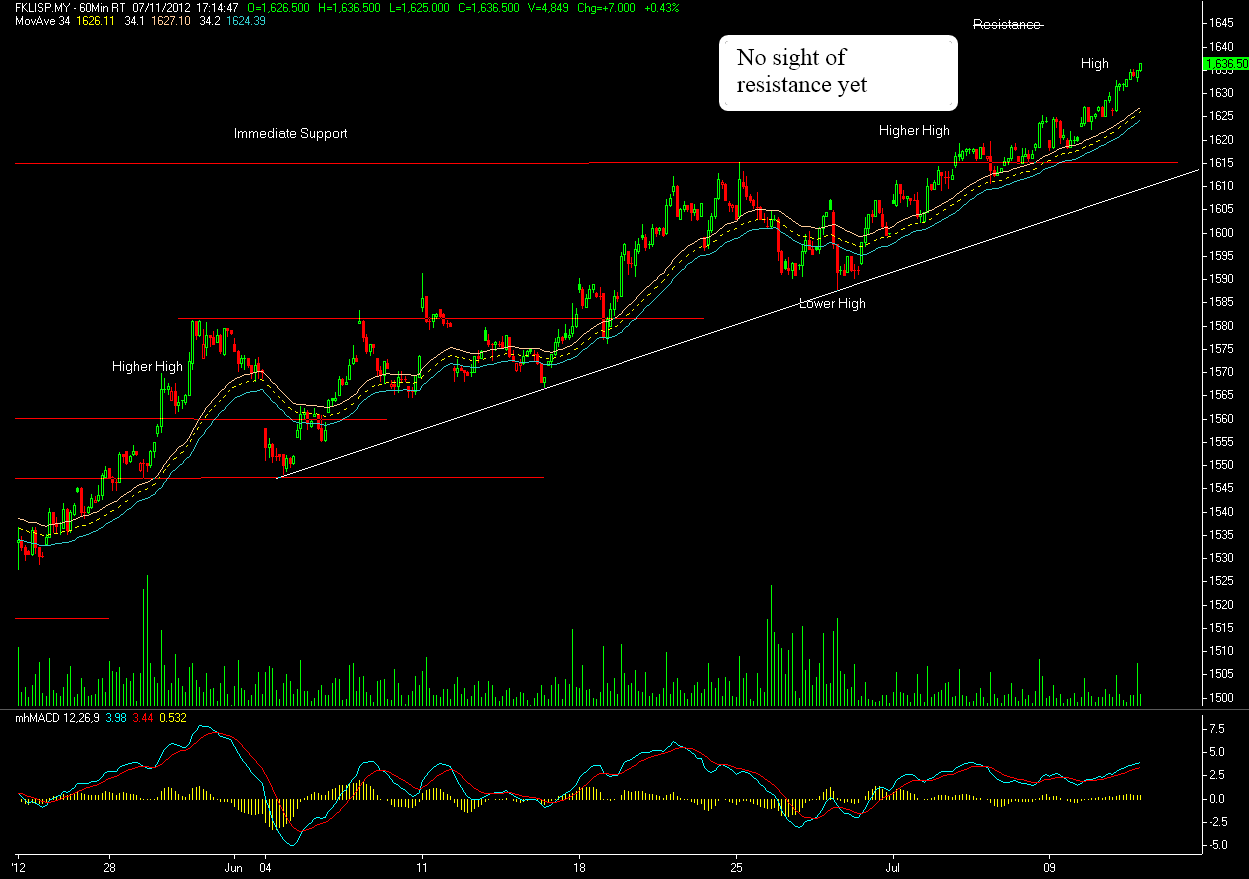
Stock index and index futures continue its winning streak yesterday with more gains made, making both of these instrument rose to their record high. With so many uncertainties on regional economy and gloomy stock market outlook due to Greece debt crisis development and pessimistic earning seasons on U.S major companies, Malaysia equity market is likely rising on its own agenda. Traders have to stop looking out for some correlation out there as there is none of them to relate with our local stock market Bullish formation. It is far better to look at the "price" itself. Hence, by following technical analysis, traders can make better call rather than looking at some other fundamental factors. Market is still running on Bullish gear at the moment despite some Bearish divergence and overbought reading you can find on smaller time frame chart. According to most trend following practise, these traders would not budge and prefer to hold their positions until it is proven that the market is reversing its role. Else, they will just maintain their positions and view along the way. It was not a conspiracy or some Bear trap when the market finally break out from its previous high and continue to rally with new highs for the past week but rather it is a strong commitment sent by Buyers to kept on accumulating in the market. For most who think the uptrend should have come to rest or retrace, most of them will be surprise as there is no sign of weakness yet. For today, support is located around 1,628 while resistance is pegged around 1,644.
Daily Pivot Point
R2= 1644
R1= 1640
S1= 1628
S2=1621
FCPO- Volatile Week With Uncertainties On Commodities Prices

CPO futures went down yesterday on a volatile trading session amid sudden fall on Soya oil during Asian time. After recovering to 3,161 on morning session, the benchmark Sept just free fall down to 3,080 level and finally settle RM48 lower to 3,082 level. It was a no trend trading day yesterday when the market just swing more than 80 points on a single trading session. Most Buyers and Sellers are caught on surprise when the market quickly reverse its role in seconds. The Soya oil was traded down about 0.28 cents to 54.01 cents per pound (7.15pm +8GMT) after it recovered to 54.30 on early Asia trading time. Looking at external ground, commodities market is now effected with stronger Dollar value and if you narrowed it down to Soya oil and palm oil market, both instrument have to considered sudden weak data on demand and export. Technically, traders can expect further downside potential for the benchmark Sept as it has breach below the support trend line yesterday and more lower highs and lower lows have been formed on hourly chart. Easier said than done, this would not be a simple Bearish market where you get ready and Short when the market recover, but rather taking some time to analyse what is the price formation is telling you. Now, with big swing available for intraday session, big sum of money can be made in short term as well, all you need to do is take you pick. Resilient is the keywords here, the only way to survive or make some money out of this market condition is trade with tighter stops and be aggressive (not stupid). For today, pivot support is located around 3,026 while resistance is pegged at 3,135.
Daily Pivot Point
R2=3188
R1=3135
S1=3054
S2=3026
Disclaimer: Information and opinions contained in this report are for educational purposes only. While the information contained herein was obtained from sources believed to be reliable, author does not guarantee its accuracy or completeness.
0 comments:
Post a Comment